The profit & loss statement summarizes the revenues, costs, and expenses incurred during a specific period, usually a fiscal quarter or year. It is also known as the Income Statement.
It can help you in assessing your organization's operational efficiency and profitability. It helps in understanding if your organization is generating profit or incurring losses, guiding decision-making regarding cost control and revenue generation strategies
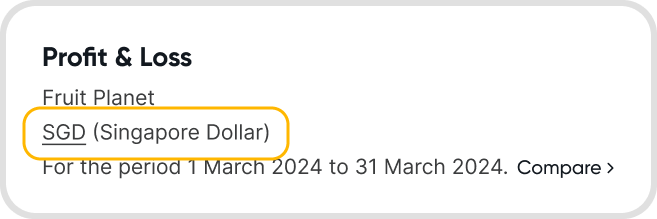
Yes, you can select any date range to view the profit & loss statement of that particular time frame. Alternatively, you can use pre-defined time ranges for quick date update.
By default, the profit & loss statement will display values in your organization's base currency.
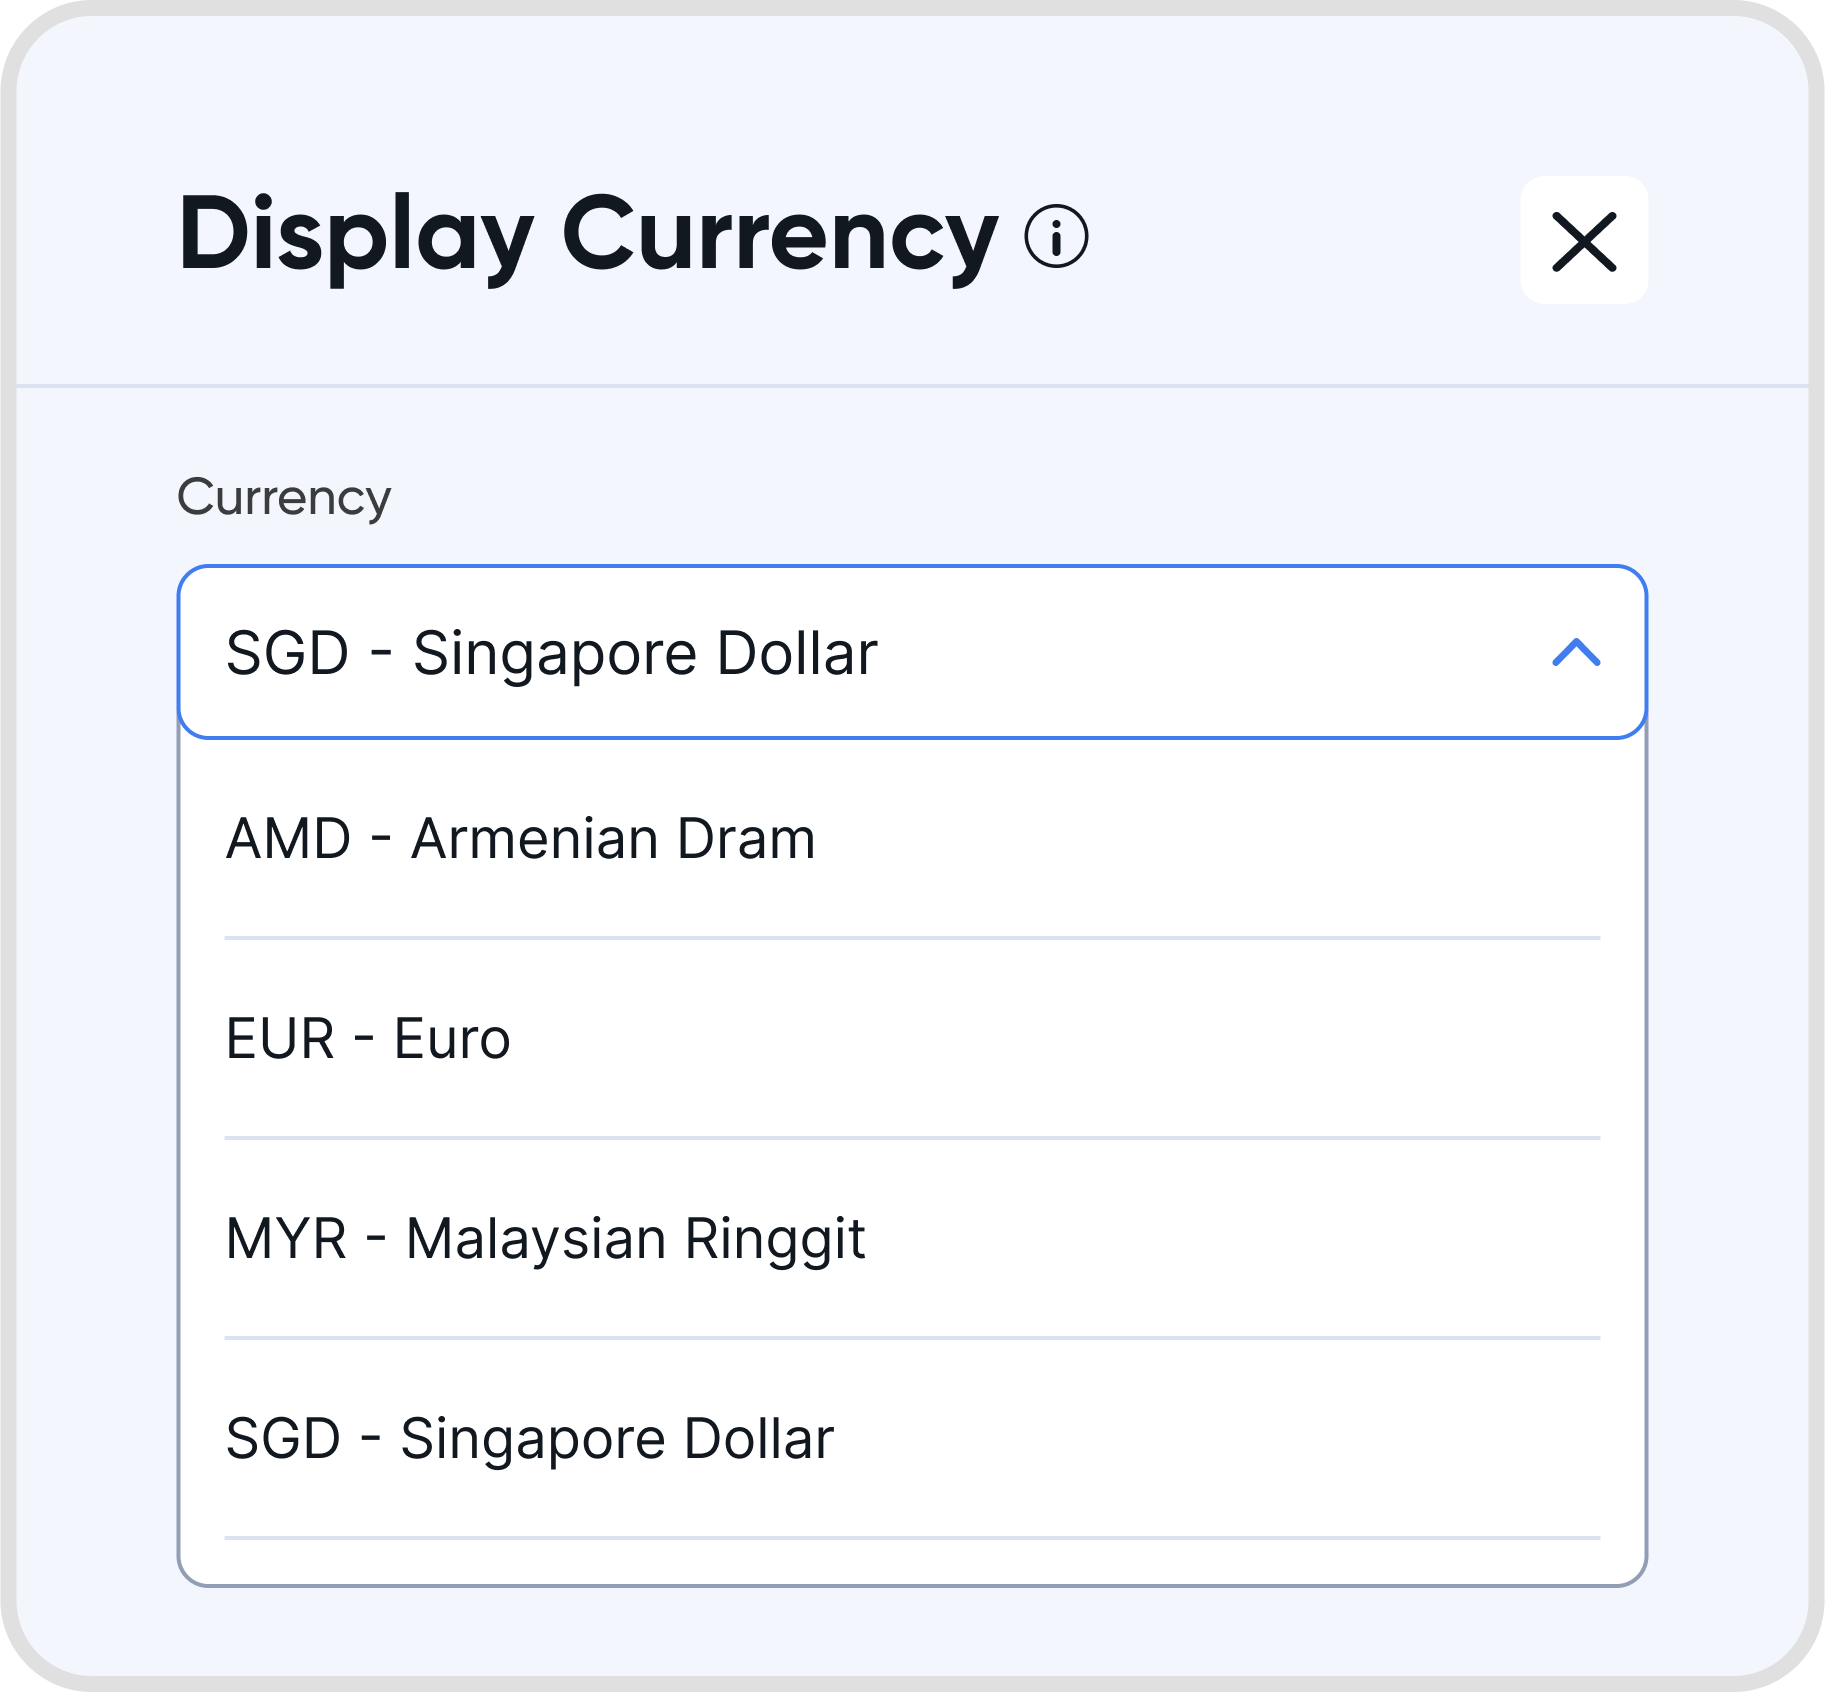
You can change the display currency of the profit & loss statement to other currencies that have been set up in your organization. For more information about setting up other currencies, refer to Accounting.
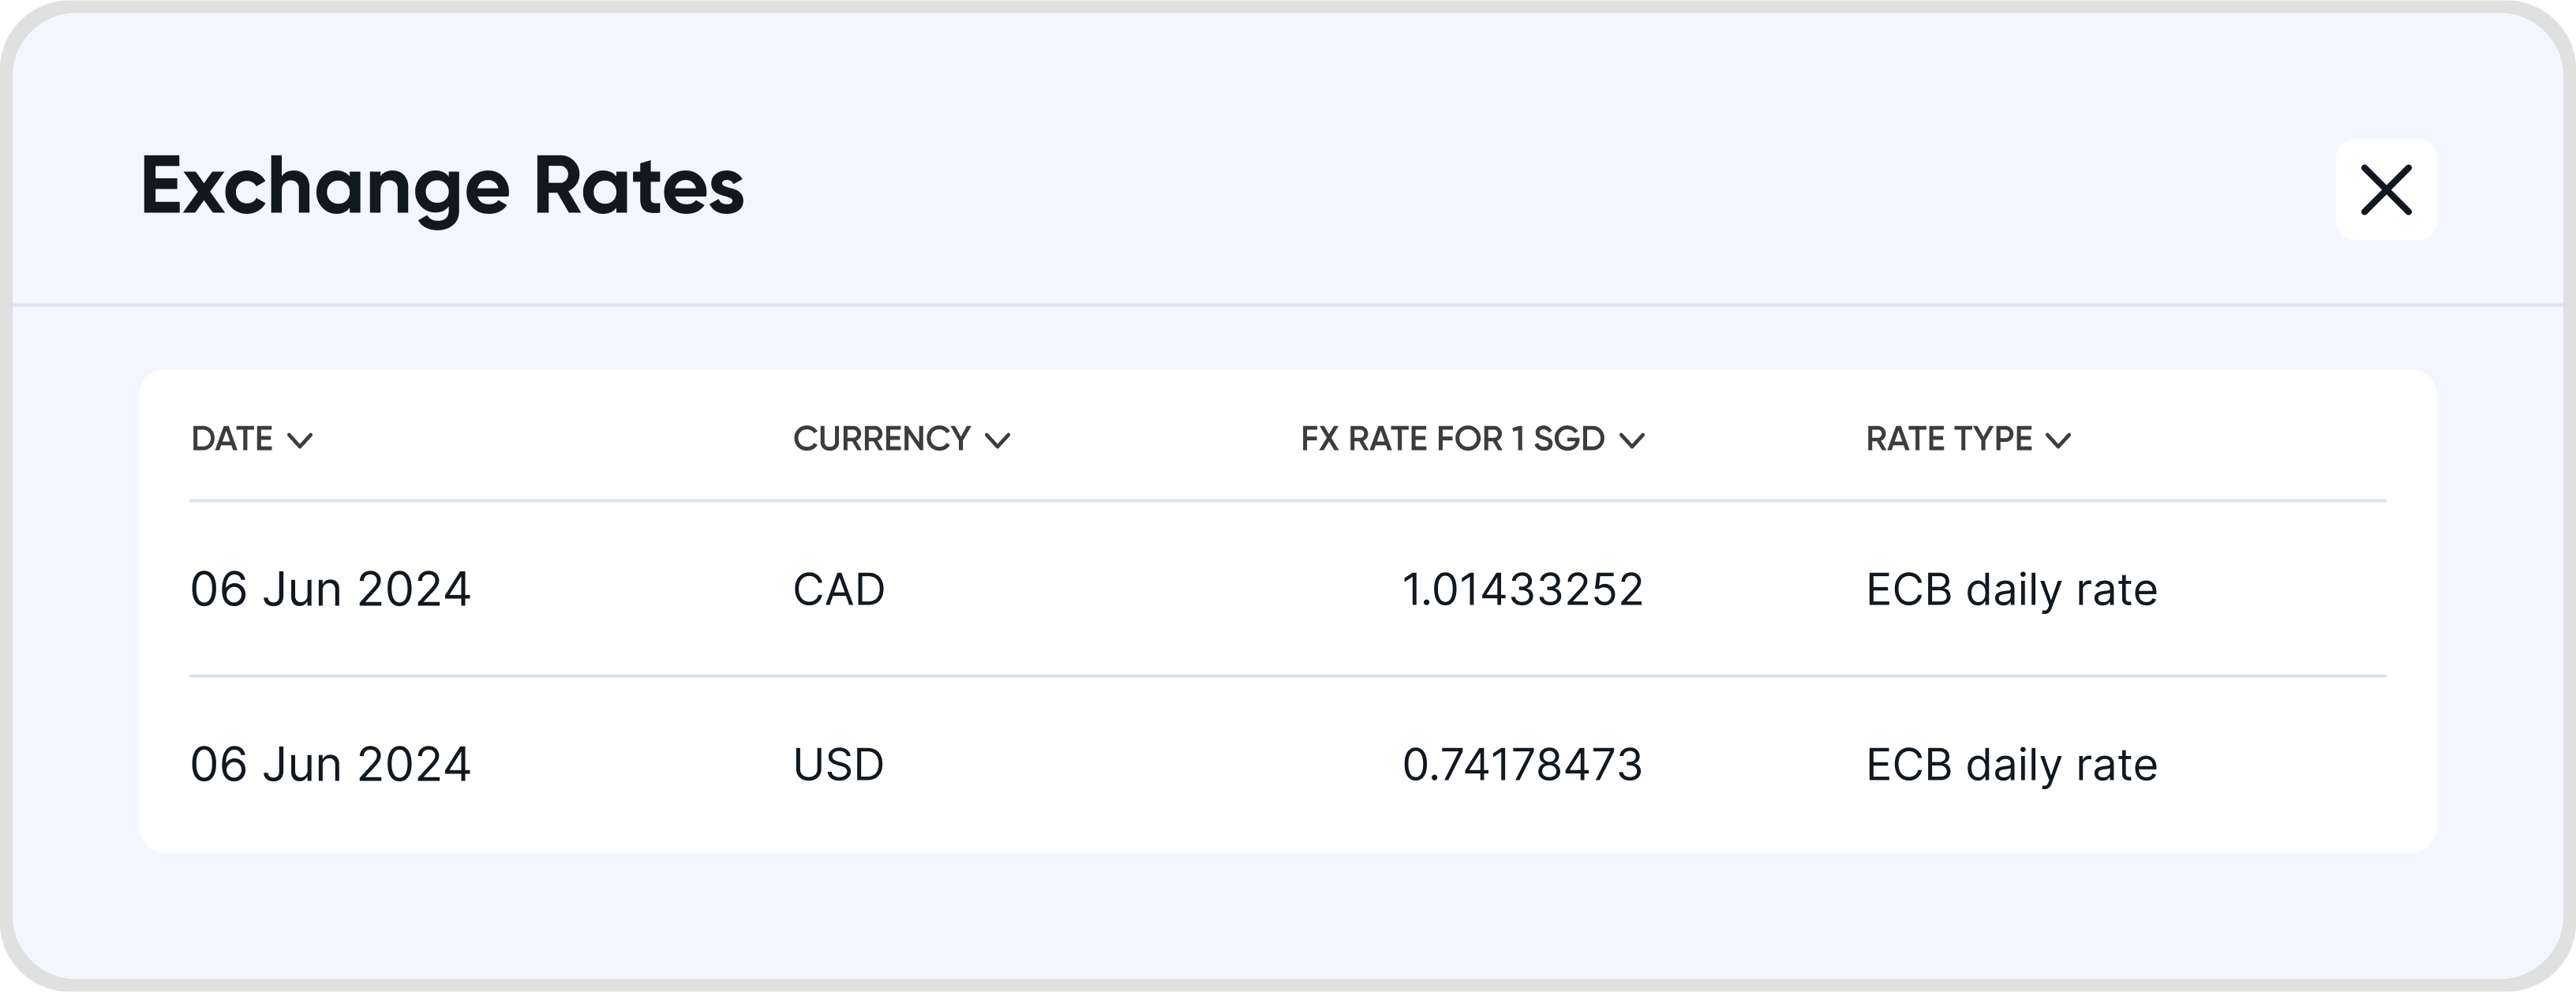
At the bottom of the page, click on See All Rates.
You will be shown a list of all exchange rates used to convert foreign currency transactions back to the organization's base currency.
Other information include the date of the exchange rate, as well as the rate type.

Yes. The Profit & Loss statement now supports deeper analysis by displaying the following as columns:
Tracking Tags: View tracking tags as columns.
Nano Classifiers: View nano classifiers as columns.
Contact Groups: View contact groups as columns.
Periods: View periods as columns based on your selected date range.
Common Size: Display percentage breakdowns alongside period columns for easier comparison.
Note: If the selected period has no matching data, no results will be shown. For example, applying a Nano Classifier for Q1 2025 while viewing Mar 2026 will return “No Nano Classifier” columns.
You can select a View By option to break down your Profit & Loss. For example:
View revenue by branch or business location using Tracking Tags.
Analyze performance by classification using Nano Classifiers.
Compare results across different periods.
Note: Dynamic amounts such as FX revaluation and unrealized gains/losses are not shown when viewing the report by tags or groups.
Yes, you can download the report in Excel or PDF formats.
See below for an example of the downloaded file.

Yes, enable Print Report Notes in Options to add and format notes below the report. These notes will be included in the exported report.
Yes. Click the Chart icon to open the Profit & Loss Chart view.
The chart allows you to visualize trends over multiple periods and switch between:
Amounts
Sales/Receipt
Cost of Sale
Gross Profit
Operating Expense
Operating Profit
Net Profit
Ratios, including:
Gross Margin
Operating Margin
Net Margin
This helps you analyze performance trends and profitability over time.
Note: The chart categories and labels are based on your selected report template.
Yes. In the chart view, click the “Periods” link to open the Compare Periods settings.
You can:
Compare with previous months
Select the total number of months to display
Adjust the display order
The chart will update automatically based on your selection.
Yes, enable Print Exchange Rates in Options to display them below the report. They will also appear in the exported report.
Yes, profits or losses roll over dynamically. Changes to transactions or financial year-end will be reflected automatically in the Retained Earnings account.