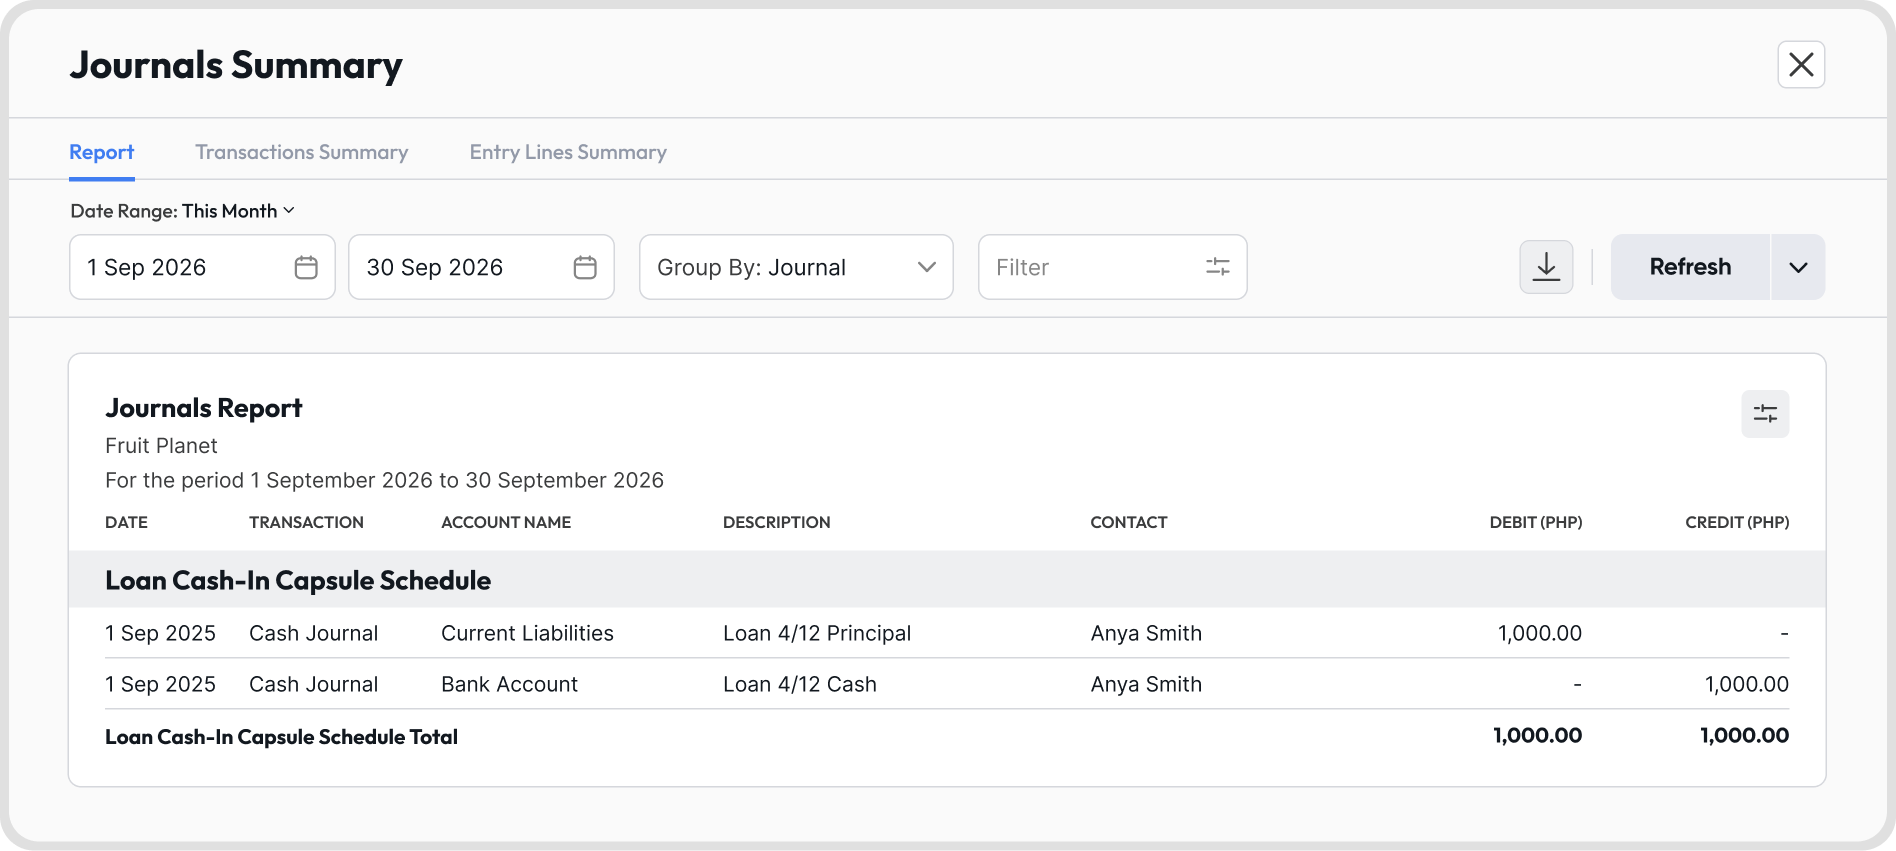
Journals Summary is a report that gives you an overview of your journal entries for a selected date range.
It is organized into three tabs:
Report
Transactions Summary
Entry Lines Summary
It helps you review journal activity and export journal data for analysis or reporting.
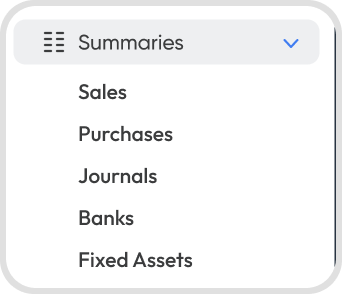
Go to Reports → Summaries → Journals.
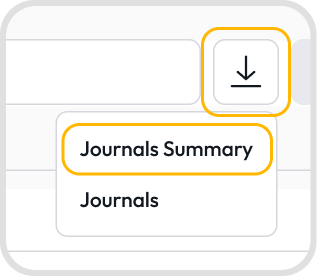
You can also download the Journals Summary from the Journals page. Click the download button at the upper right of the page.
Report: the lines of each journal entry, including the accounts, descriptions, contacts, debits, and credits.
Transactions Summary: one row per journal entry, with its reference, contact, and total debit and credit.
Entry Lines Summary: a list of individual journal entry lines, with the account, description, debit, and credit of each line.
Click the Date Range dropdown and choose a preset option:
This Month
This Financial Quarter
This Financial Year
Last Month
Last Financial Quarter
Last Financial Year
You can also set a custom start and end date using the date fields.
Click Refresh to reload the report with the new date range.
Note: The date range you select applies to all tabs: Report, Transactions Summary, and Entry Lines Summary.
Yes. Click Group By and choose one of the following:
Journal
Contact
None
Click Refresh to reload the report with your grouping applied.
When grouped, each group shows a total for debits and credits.
Note: Group By is only available in the Report tab. The Transactions Summary and Entry Lines Summary tabs support filtering only.
Yes. Click Filter and apply the filters you need.
Click Refresh to reload the report with your filters applied.
To clear your filters, click the X beside Filter.
Note: Filters apply only to the tab you set them in.
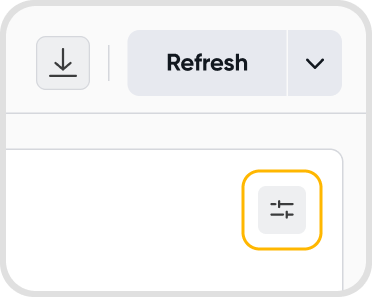
Open the column settings: click the adjust column icon at the upper right of the report
Add or remove columns: select the columns you want to show
Reorder columns: arrange the selected columns in the order you want them to appear
Your changes appear in the report right away. You do not need to click Refresh.
Note: Column settings are saved per tab. The next time you open Journals Summary, each tab keeps the columns and order you set until you change them.
Open the download options: click the download icon beside Refresh
Choose a format: select Excel or PDF
The format you choose determines what is included:
Excel: downloads all three tabs, with Report, Transactions Summary, and Entry Lines Summary each saved as a separate sheet in one file. Each sheet reflects the filters, columns, and grouping set on its tab.
PDF: downloads only the tab you are currently viewing.
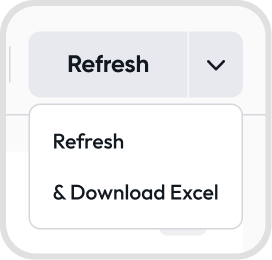
Yes. Click the arrow beside Refresh, then select Download.
Choose one of the following:
Excel
Both
The report refreshes with your latest settings and downloads in the format you selected.
Note: If the tab has more than 12 visible columns, only Excel is available.
PDF downloads support a maximum of 12 visible columns.
If the tab you are downloading shows more than 12 columns, an error appears when you try to download it as PDF.
To download it, reduce the visible columns to 12 or fewer using the adjust column icon, or download the report in Excel instead.
Use the page arrows or page numbers at the bottom of the report to move between pages.
To change how many rows appear per page, click the rows-per-page dropdown at the lower right, such as 100 per page.