Diagnostics is an analysis report that reviews your records for patterns that need attention, such as customer concentration, overdue receivables, and unreconciled items.
Each finding shows:
What was detected: the metric type and the analysis it belongs to.
How serious it is: the severity assigned to the finding.
How far it moved: the deviation compared against the threshold that triggered it.
Why it was flagged: the trigger reason, including the values behind the finding.
Example: a contact is flagged under Concentration when it accounts for 83.97% of revenue against a threshold of 10.00.
Go to Reports → Analysis Reports → Diagnostics.
Diagnostics runs three reports, each in its own tab:
Receivable Risk: reviews who owes you money, including customer concentration and receivables aging.
Expense Health: reviews your spending for patterns that fall outside your normal range.
Reconciliation Checks: reviews your bank reconciliation for items that need attention.
Each tab runs its own report with its own filters, groupings, and columns. Only one tab is displayed at a time.
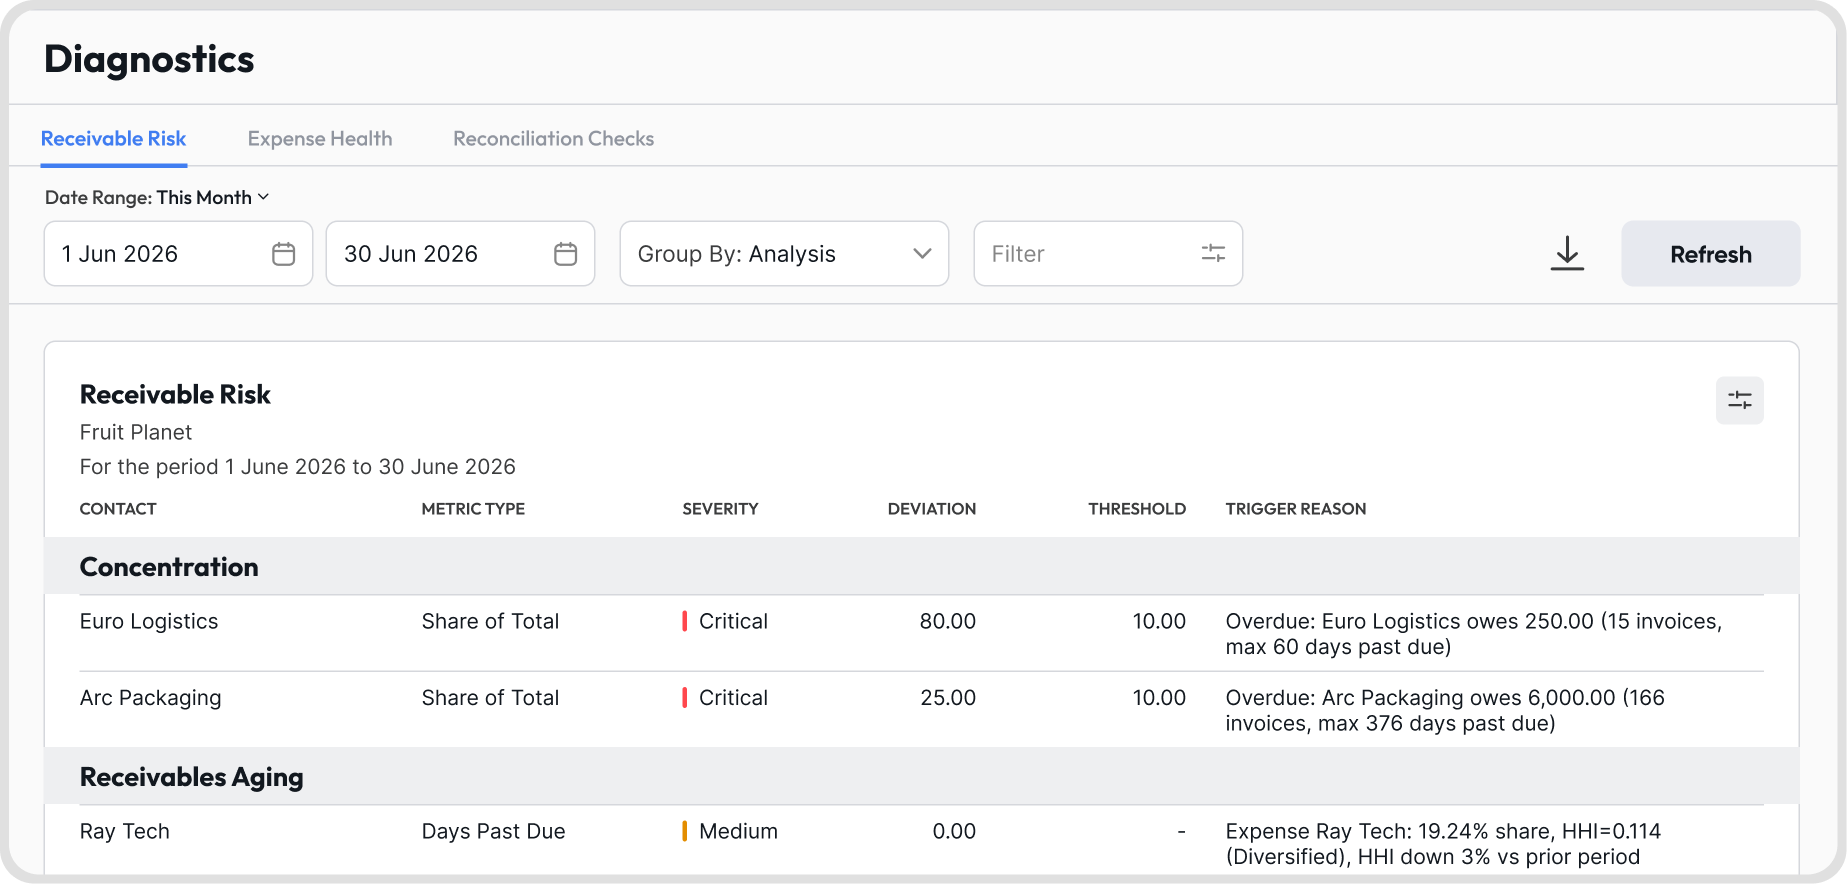
Select a tab: choose Receivable Risk, Expense Health, or Reconciliation Checks.
Set the date range: choose a preset range or enter your own start and end dates.
Choose a grouping: use Group By to control how findings are grouped in the report.
Apply filters: use Filter to narrow the findings included. This step is optional.
Click Refresh: the report is generated for the selected period and filters.
The report header shows the organization name and the period covered.
Select a preset range from the Date Range list:
This Month
This Financial Quarter
This Financial Year
Last Month
Last Financial Quarter
Last Financial Year
You can also set your own period by entering a start date and end date in the two date fields.
Note: Click Refresh after changing the date range to regenerate the report.
Click Group By and select how you want the findings grouped:
Analysis: groups findings under the analysis that triggered them, such as Concentration and Receivables Aging.
Contact: groups findings under the customer or supplier they relate to.
Bank Account: groups findings under the bank account they relate to.
Severity: groups findings by how significant they are.
Each group is shown as a header row, with its findings listed underneath.
Note: Contact is not available as a grouping in Expense Health.
Click Filter.
Expand a filter and set the values you need.
Click Apply to run the report with the filters applied.
Click Cancel to close the panel without applying anything.
No. Each tab supports its own filters:
Receivable Risk: Amount, Contact.
Expense Health: Amount, Transaction Reference.
Reconciliation Checks: Amount, Transaction Reference.
Click the column icon on the report card to open Adjust Columns, then move columns between Hidden Columns and Selected Columns and click Save.
Each tab has its own set of columns.
Receivable Risk
Shown by default: Contact, Metric Type, Severity, Deviation, Threshold, Trigger Reason.
Available to add: Currency, Amount, Analysis Type.
Locked: Contact and Metric Type always appear.
Expense Health
Shown by default: Metric Type, Severity, Date, Deviation, Threshold, Trigger Reason.
Available to add: Reference, Currency, Amount, Analysis Type, Baseline.
Locked: Metric Type always appears.
Reconciliation Checks
Shown by default: Date, Reference, Contact, Metric Type, Severity, Trigger Reason.
Available to add: Transaction Type, Currency, Amount, Analysis Type, Baseline, Deviation, Threshold.
Locked: Date and Reference always appear.
Note: Receivable Risk reports findings at contact level, so it does not include Date or Reference. Expense Health does not include a Contact column.
Date: the date of the record behind the finding.
Reference: the transaction reference number.
Contact: the customer or supplier the finding relates to.
Transaction Type: the type of transaction that was flagged.
Currency: the currency of the record.
Amount: the amount of the record.
Analysis Type: the analysis that produced the finding.
Metric Type: the specific measure that triggered the finding, such as Share of Total or Days Past Due.
Baseline: the normal value the record was compared against.
Deviation: how far the record moved away from the baseline.
Threshold: the point at which a finding is raised.
Severity: how significant the finding is, shown as High, Medium, Low, or Info.
Trigger Reason: a plain-language explanation of why the finding was raised.
Open Adjust Columns using the column icon on the report card.
Drag a column into the position you want using the handle beside it in Selected Columns.
Click Save.
Note: Locked columns cannot be reordered.
Yes. Click the download icon above the report.
Excel is the only supported format.
The download follows the columns currently shown in the report and the order they appear in.
The report displays No data to display when no findings match the report settings. Check the following:
The date range covers a period with records.
The filters applied are not excluding the findings you expect.
The selected tab matches the area you are reviewing.
Refresh was clicked after the last change.
Both are analysis reports, but they answer different questions:
Diagnostics: reviews the overall health of your receivables, expenses, and reconciliation, and reports findings at the level of the contact, account, or record involved.
Anomalies: reviews individual invoices, bills, journals, and cashflows, and flags the specific transactions that fall outside your normal pattern.