The Cashflow Statement details the cash and cash equivalents entering and leaving your organization, categorized into operating, investing, and financing activities over a period.
It helps assess the liquidity, solvency, and financial flexibility of your business.
Yes, you can customize the date range for the cash flow statement. Alternatively, you can also select pre-defined date ranges for quick date sets.
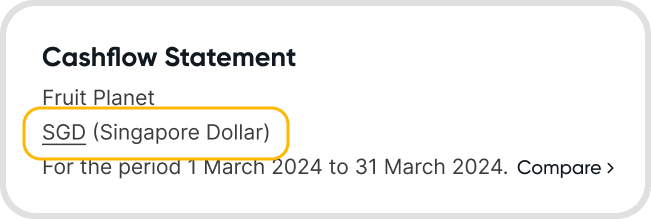
By default, the Cashflow Statement will display values in your organization's base currency.
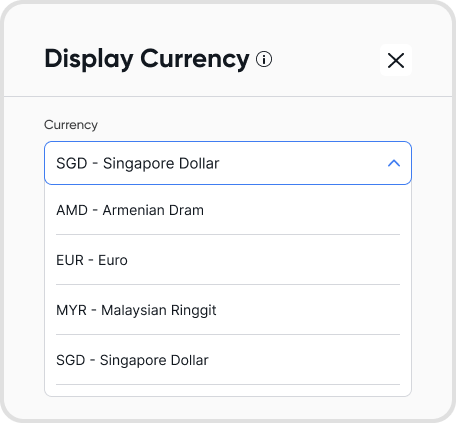
You can change the display currency of the Cashflow Statementto other currencies that have been set up in your organization. For more information about setting up other currencies, refer to Accounting.
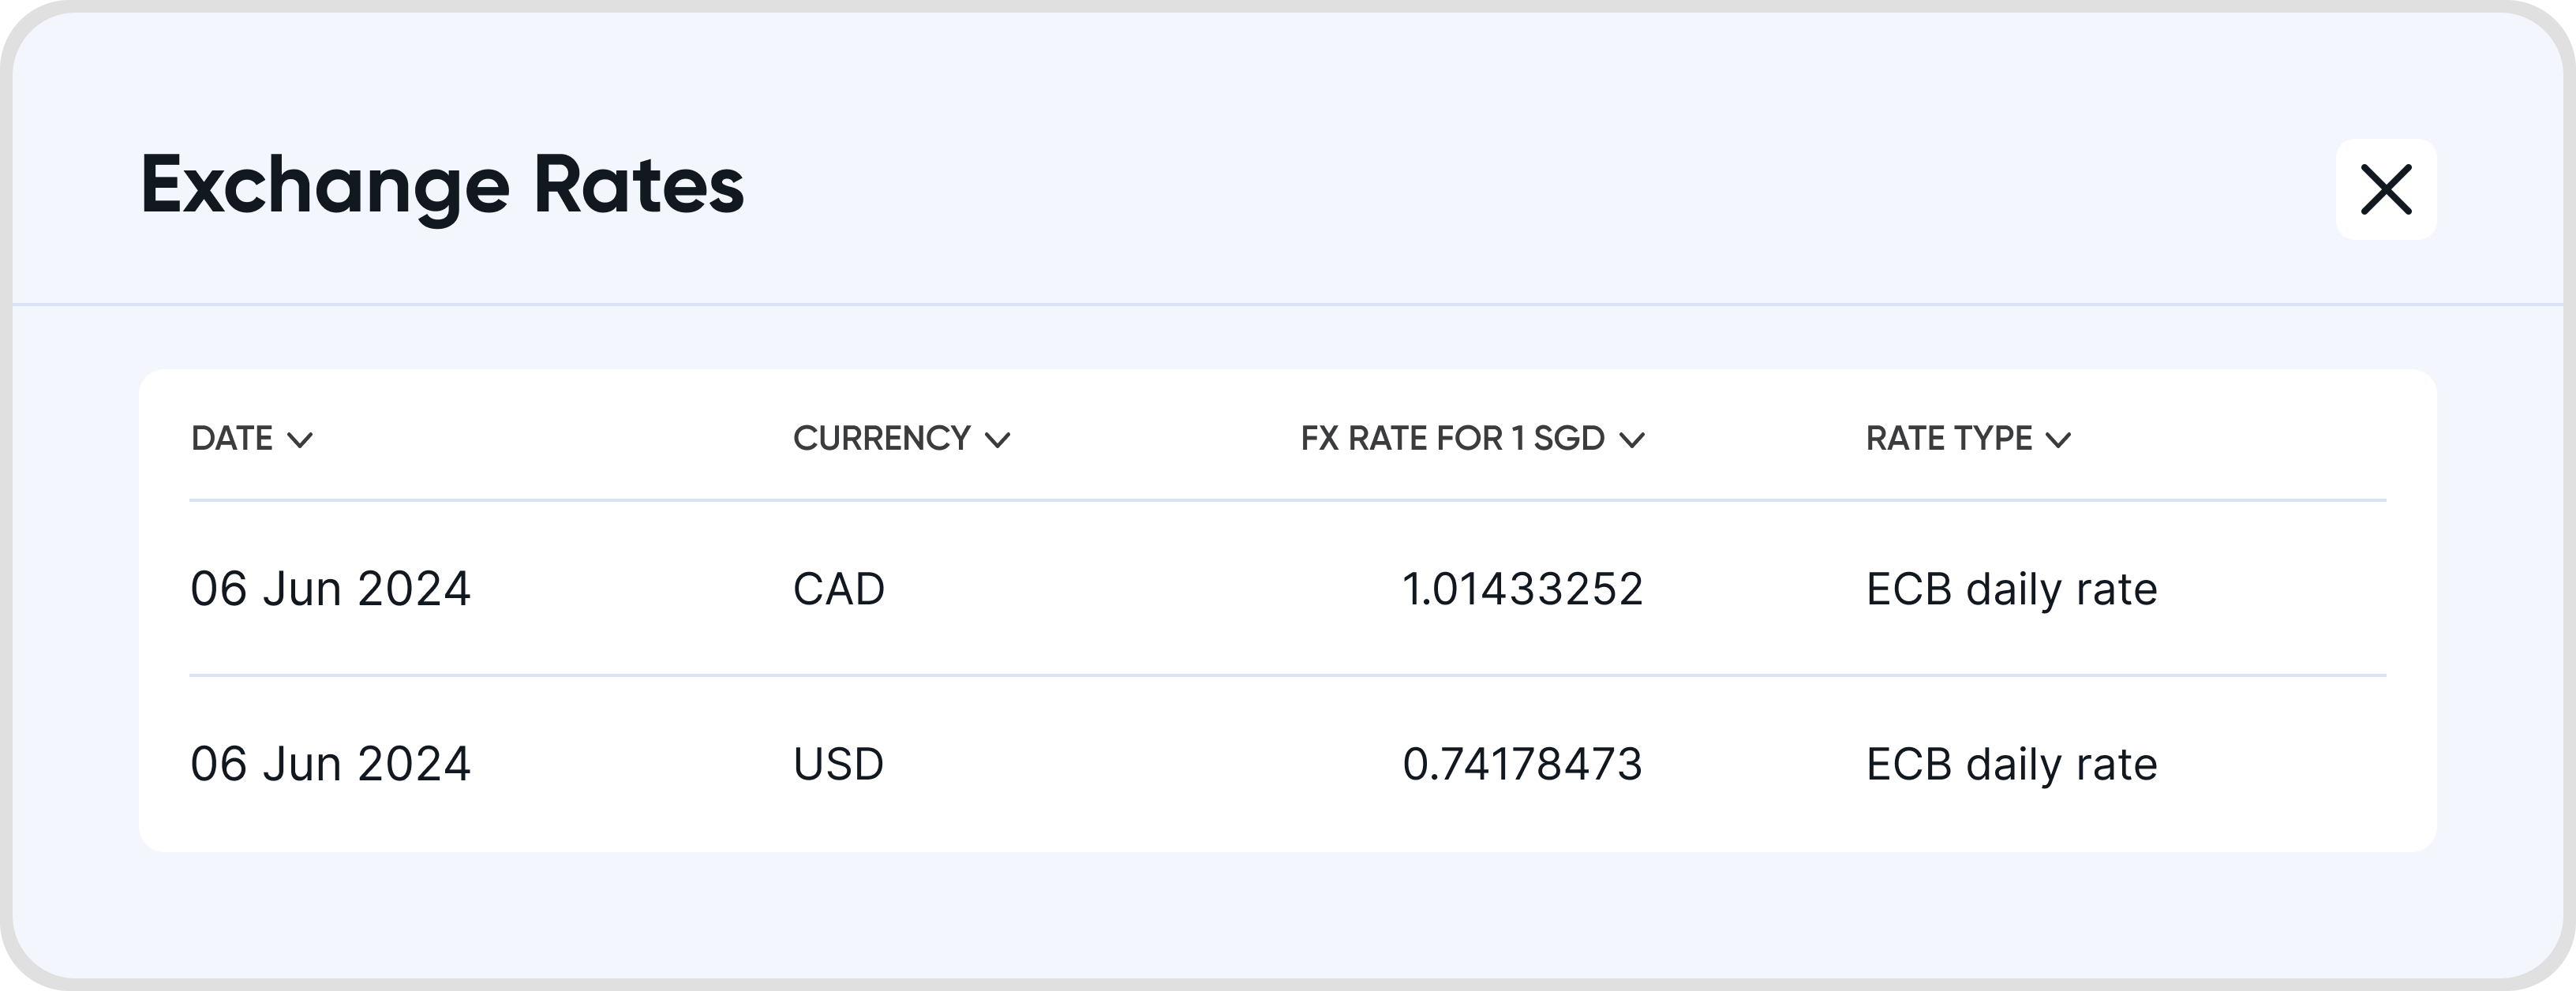
At the bottom of the page, click on See All Rates.
You will be shown a list of all exchange rates used to convert foreign currency transactions back to the organization's base currency.
Other information include the date of the exchange rate, as well as the rate type.

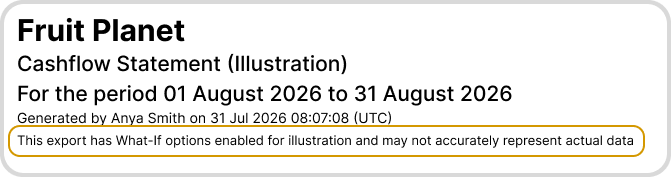
Yes, you can download the report in Excel or PDF formats.
See below for an example of the downloaded file.
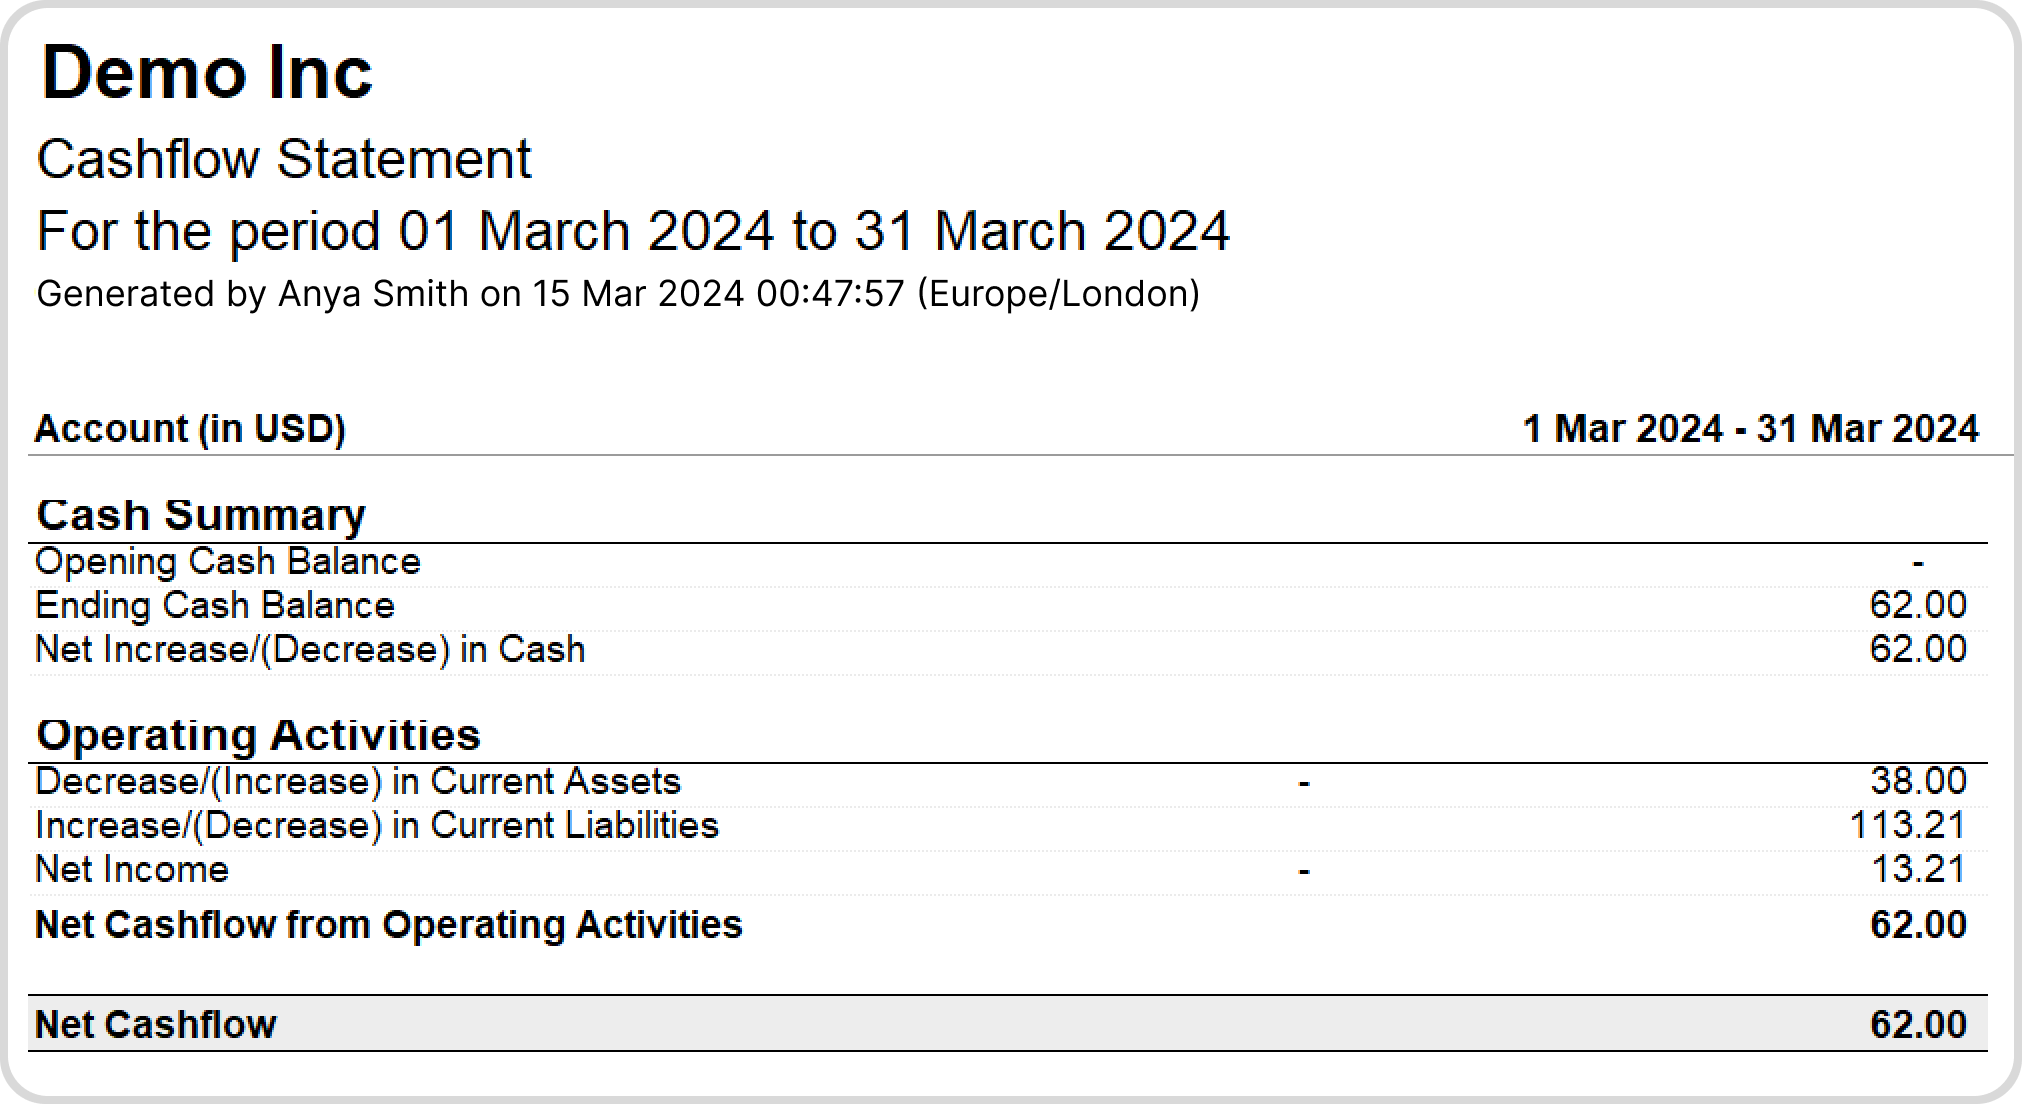
Yes, enable Print Report Notes in Reports → Cashflow → Configuration Icon → Display Options to add and format notes below the report. These notes will be included in the exported report.
Yes. Click the Chart icon to open the Cash Flow Chart view.
The chart allows you to visualize trends over multiple periods and switch between:
Amounts
Operating Activities
Investing Activities
Financing Activities
Net Cashflow
Note: The chart categories and labels are based on your selected report template.
Yes. In the chart view, click the “Periods” link to open the Compare Periods settings.
You can:
Compare with previous months
Select the number of months to display
Adjust the display order
The chart updates automatically based on your selected settings.
Yes, enable Print Exchange Rates in Reports → Cashflow → Configuration Icon → Display Options to display them below the report. They will also appear in the exported report.
Yes, enable Print Rounded Values in Reports → Cashflow → Configuration Icon → Display Options to round all values to whole numbers. This also applies to the exported report.
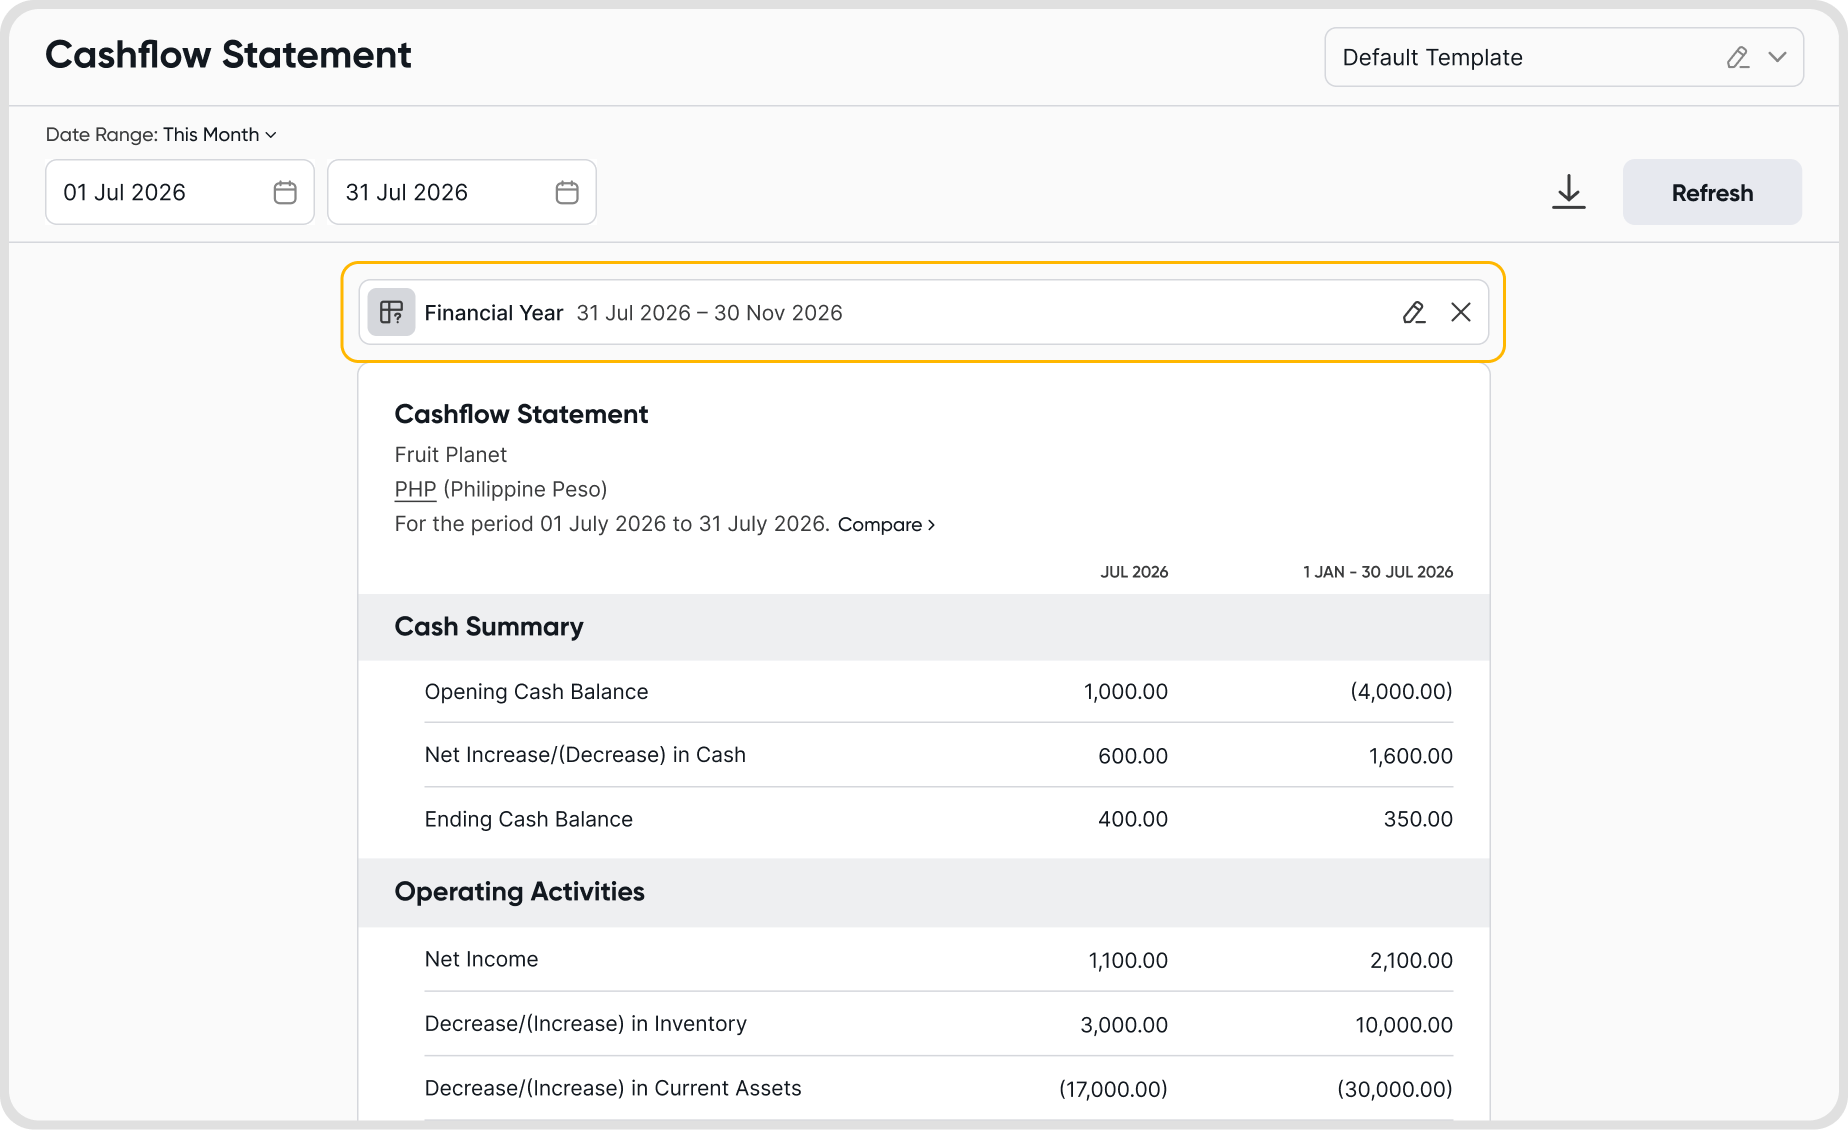
What-If runs a simulation of your Cashflow Statement using assumptions you set, without changing any recorded transactions.
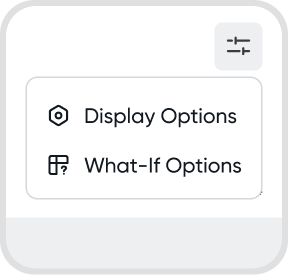
Go to Reports → Cashflow → Configuration Icon → What-If Options.
The simulation is preview only. Your actual account balances are never modified.
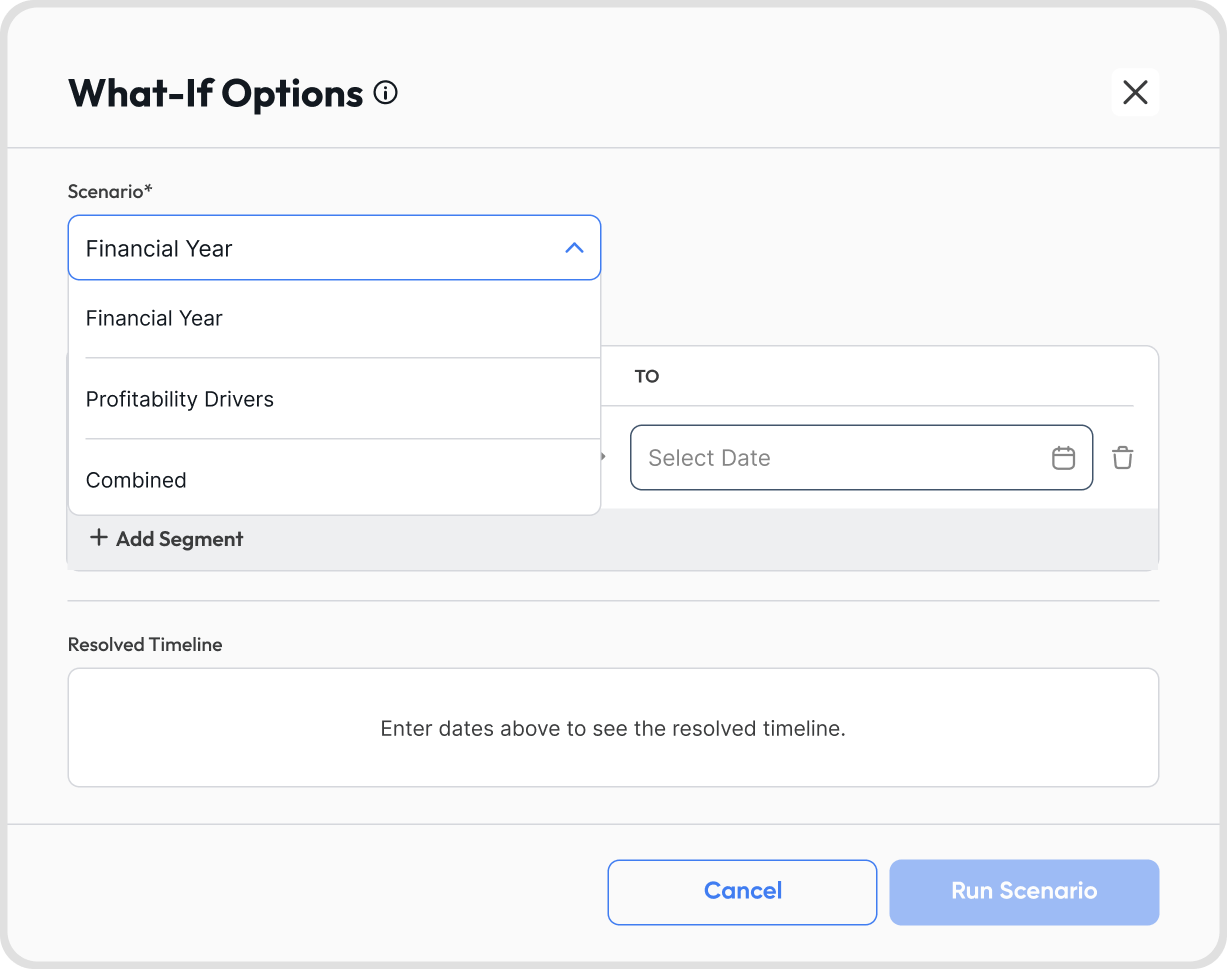
Financial Year: simulate custom financial year dates to view cash movement over an irregular reporting period.
Profitability Drivers: apply a percentage adjustment to revenue or expense variables to see how cash movement would respond.
Combined: apply a custom financial year and profitability drivers in the same simulation.
Each driver is built from three fields:
Scope: the level the adjustment applies to, either Account Type, Nature, or Account.
Target: the item being adjusted. Available targets depend on the scope selected. For Account Type, these are Direct Costs, Operating Expense, Operating Revenue, Other Expense, and Other Revenue.
Percentage: the adjustment applied to the target. Entering 20% multiplies the target by 1.20.
The Percentage field accepts values from -100 to 500:
Positive values increase the target. Entering 30% multiplies the target by 1.30.
Negative values decrease the target. Entering -25% multiplies the target by 0.75.
Entering -100% removes the target from the simulation entirely.
Values outside this range are rejected, and the simulation cannot be run until the entry is corrected.
Click + Add Driver to apply more than one adjustment in the same simulation.
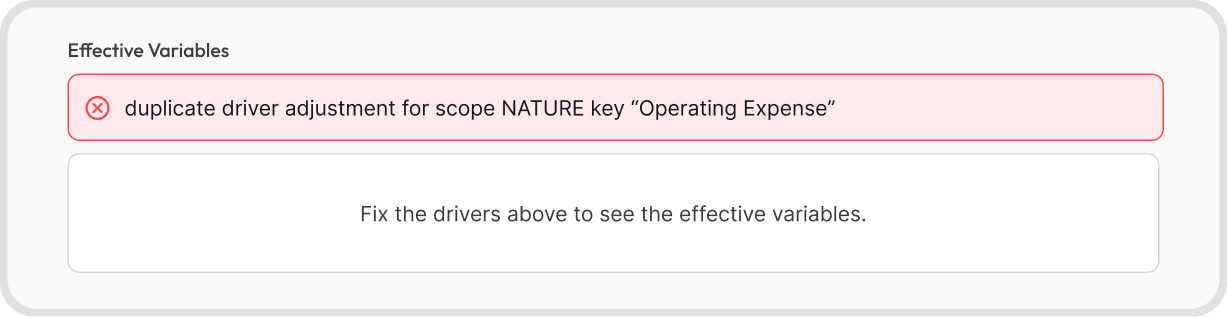
Each scope and target combination can only be used once. Adding a second driver for the same combination returns a duplicate error, and the simulation cannot be run until one of the drivers is changed or removed.
When drivers overlap across different scopes, the more specific scope takes priority: Account overrides Nature, and Nature overrides Account Type.
The Effective Variables panel shows the final multiplier applied to each scope before you run the simulation. If a driver is invalid, the panel displays the error instead of the multiplier.
Here are some example cases where What-If is helpful:
Checking whether a cost increase still leaves enough operating cash: if a supplier announces an increase, set Direct Costs to the expected percentage and review whether operating activities still generate enough cash to cover your obligations.
Modeling a revenue shortfall: set Operating Revenue to a negative percentage to see how far net cash from operating activities falls if sales miss target.
Pricing a wage or rent adjustment: set Scope to Account and select the specific salaries or rent account to model the increase on that account alone, without inflating the rest of Operating Expense.
Reviewing cash before committing to an expansion: apply the expected increase to the operating costs the expansion would add, then review whether the remaining cash supports the investment you are planning.
Reporting to a parent company with a different year end: if your parent closes on March 31 while you close on December 31, simulate the March year end to produce group reporting figures without maintaining a second set of books.
Matching your year end to your business cycle: if your peak season straddles your current year end, simulate a year end that falls after your peak to see how cash movement looks when a full cycle sits inside one period.
Yes, you can export the simulated report in Excel and PDF formats.
The exported file includes a note identifying the figures as the result of a What-If simulation and the report title has “(Illustration)”, so they are not mistaken for actual reported figures.